


Data Visualization
We customize our solutions based on your requirements and the KPIs you want to measure. Also, we enable self-service reporting so that you are less dependent on IT or MIS departments.
Benefits of Data Visualization
The benefits of data visualization for decision-makers come from many aspects, including improving data insights. Learn about our data visualization services and how they can help your organization
Business-specific reports
Each monitors departments and functions, KPIs are necessary. Depending on the role of the users, we create custom reports and dashboards.
Spreadsheet dependency reduced
In most organizations, data tracking and the business user has a different reporting requirement based on the role they play. For CXOs reporting is still handled by spreadsheets. It is an expensive and time-consuming process that makes it difficult to make decisions. Visualization of real-time data in various formats can unlock the value of data and harness its potential with advanced data visualization.
Effortless data filtering
In addition to being able to drill down into the information, it also allows you to view results from many different perspectives. A good way to analyze your advertising ROI is to break it down by channel and find out which ones are performances.
Easily interpret complex data
The data visualization services we provide allow users to digest data easily by presenting it in interactive charts, graphs, maps, etc. Users can easily make sense of large datasets.
Auto-reporting
Access to information and insights is easy with Compass because it allows decision-makers to access them without assistance from IT. Your company becomes a truly data-driven organization because of providing the data that employees need on the go.
Our Data Visualization Process
When you begin your project with e2logy, you will be backed up round the clock by a dedicated and skilled team. The business processes we define and implement are tailored to meet your needs, geared towards reducing business costs and increasing your business' competitiveness. Following the launch, we offer post-launch support and updates based on the analysis of your requirements.
Data collection
It is crucial to assemble the right data to visualize it effectively. For the statistics to be true, we need to plan how to obtain the right data. Occasionally, data must be collected from multiple sources as well.
Clean data
Creating a visualization requires a thorough cleaning of data. The addition of erroneous visuals that contain anomalies is often caused by data that has incorrect, empty, or false values. When processed, a clean dataset provides accuracy. Depending on what dataset you are cleaning will depend mainly on the context.
Choosing a chart type
Data and evidence need to be represented visually in the chart or graph. Analyzing insights, datasets, and comparing and contrasting data is used to make decisions. Choosing the most suitable chart usually requires some experimentation.
Prepare data
Data may need to be transformed according to requirements once the chart has been finalized. Finalizing data columns that will be used, grouping data, combining variables into new columns, etc., are some data preparation tasks.
Visualize data
Creating visualizations requires the data you have collected in the final step. After we prepare the data, we apply the skills of data visualization to it and present it in the form of charts or graphs with meaningful insights.
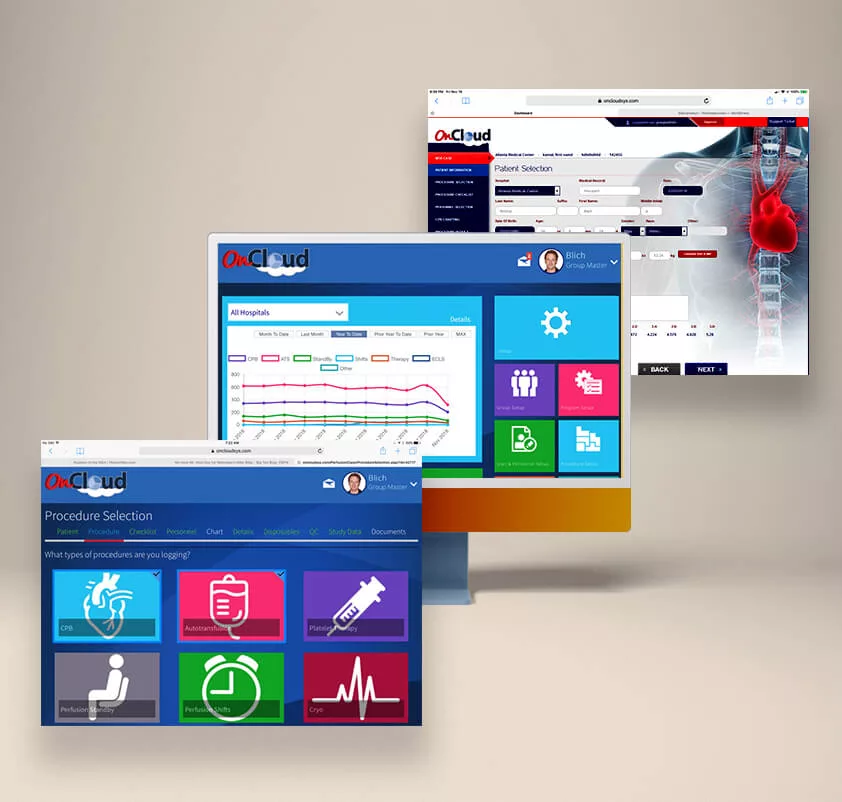
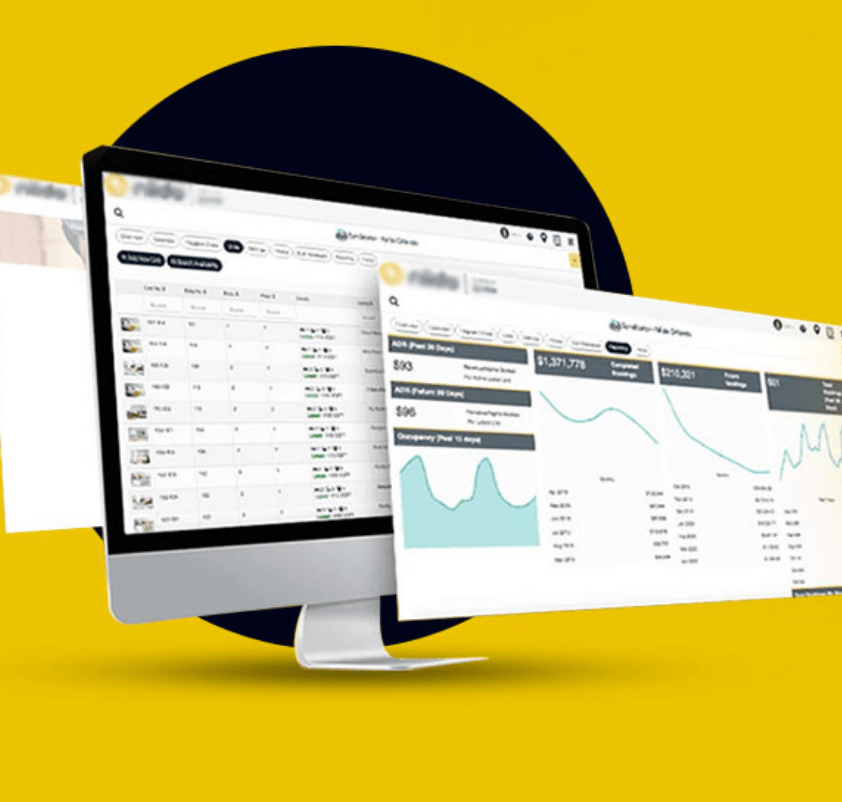
Our Work

Why E2logy for Data Visualization Services?
We at E2logy can provide you a solution based on your specific requirements if you need a professionally looking app for your business, regardless of whether you are a start-up or a large enterprise.
Customized services
Data visualization models can be improved by E2logy based on its review of your current model. If you have specifications for an app and a preferred technology stack, we can develop a customized version of it from scratch.
Extensive expertise
In the business intelligence and analytics space, E2logy has implemented many solutions. Partnering with some of the top BI companies and working with other visualization tools has been an advantage for our company.
Mobile friendly
In addition to being a desktop-compatible viewer, E2logy's data visualization reports have many advantages. All mobile devices are supported for reporting with rich visualizations. Management can monitor key performance indicators on the move.
Maintenance and support
The company provides initial training on the tool's features and functions, however, they also provide maintenance and support to ensure the system is fully utilized within your company.
WE WORK WITH

SMEs
Engaged both small and medium enterprises (SMEs). As a leading IT company in this digital age, we make small, medium and large companies improve the way they do business with their clients, vendors, employees, and partners.

AGENCIES
Providing services to consulting companies, independent software vendors (ISVs), companies developing software products, or agencies. Providing end-to-end services or serving as an extended team, we partner with agencies to build their clients' projects.

STARTUPS
Experience working with more than 100+ global tech startups for their web, cloud, mobile, IoT, and blockchain needs. No matter what stage you are in - Seed, Expansion, or even in the pre-seed phase - we empower and support startups with our digital expertise and experience.
SMEs
Engaged both small and medium enterprises (SMEs). As a leading IT company in this digital age, we make small, medium and large companies improve the way they do business with their clients, vendors, employees, and partners.
AGENCIES
Providing services to consulting companies, independent software vendors (ISVs), companies developing software products, or agencies. Providing end-to-end services or serving as an extended team, we partner with agencies to build their clients' projects.
STARTUPS
Experience working with more than 100+ global tech startups for their web, cloud, mobile, IoT, and blockchain needs. No matter what stage you are in - Seed, Expansion, or even in the pre-seed phase - we empower and support startups with our digital expertise and experience.